

Keywords
Demographic Transition
How to Cite
Aliaga-Linares, Lissette. 2020. “The Demographic Transition Graph”. TRAILS: Teaching Resources and Innovations Library for Sociology, October. Washington DC: American Sociological Association. https://trails.asanet.org/article/view/the-demographic-transition-graph.
Abstract
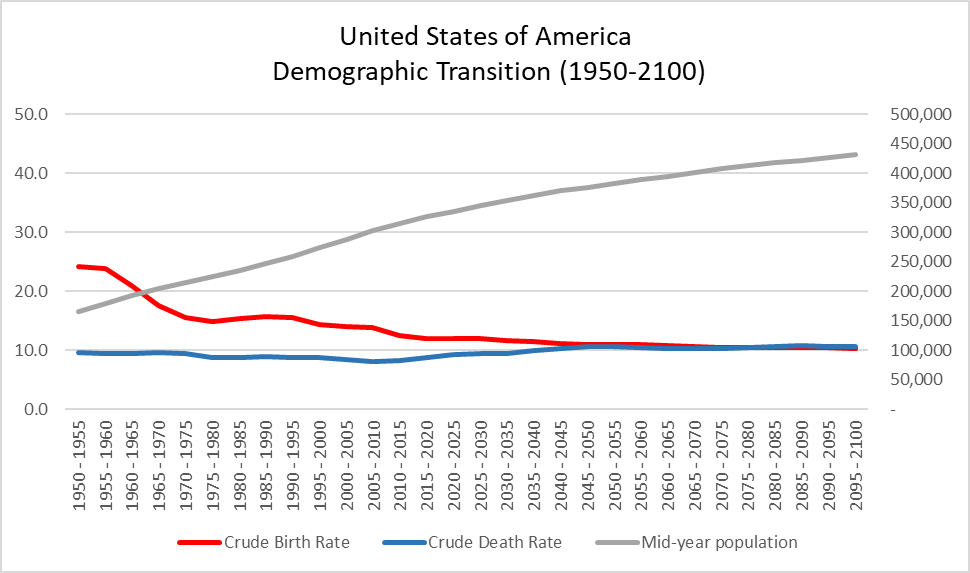
The Demographic Transition Theory remains one of the pivot conceptual tools in population research. This theory started with a description of demographic changes in 18th century Europe and onward, which are still present in many developing countries. Since then, demographers and social scientists have revisited early assumptions, given the different...Download this resource to see full details. Download this resource to see full details.
Details
- Subject Area(s):
- Demography
- Resource Type(s):
- Class Activity
- Class Level(s):
- College 300
- Class Size(s):
- Small
Learning Goals and Assessments
Learning Goal(s):
- 1. Students will create a demographic transition graph in excel using the appropriate conventions
- 2. Students will gain experience navigating international databases
- 3. Students will identify the components of the Demographic Transition theory, its stages, and the timing of the stages a country has gone through since the 1950s and is projected to go through up to 2100.
Goal Assessment(s):
- Students will submit the demographic transition graph for a country of their choosing in an excel worksheet at the end of the activity.
- To complete this class activity, students will need to gather data from the United Nations World Population Prospects database portal
- Students will submit a written interpretation of the demographic transition stages and their timing
When using resources from TRAILS, please include a clear and legible citation.