

Keywords
Quantitative Literacy
Social Inequality
How to Cite
Abstract
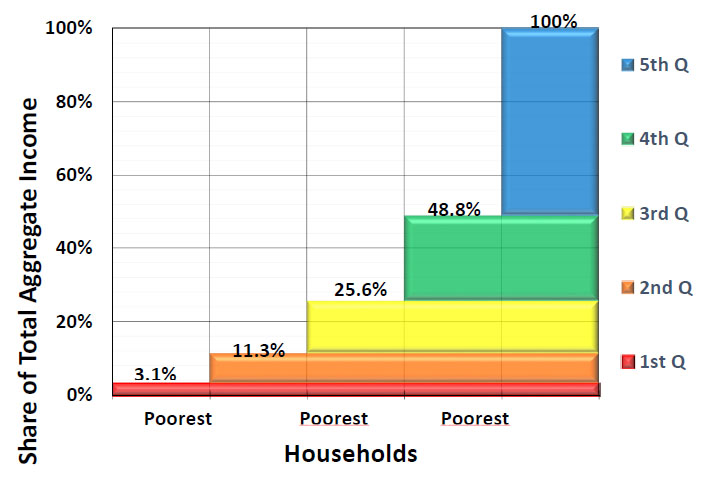
This series of brief videos (three parts, approximately 27 minutes total) explains to students the logic of the Gini Coefficient as the most common measure of income inequality, and explains how it is derived through a sequence of basic steps. The first video explains the logic of an income distribution; the second video explains how to construct a Lorenz...Download this resource to see full details. Download this resource to see full details.
Details
- Subject Area(s):
- Stratification/Mobility
- Resource Type(s):
- Video
- Class Level(s):
- Any Level
- Class Size(s):
- Any
Usage Notes
The video series is designed to be used as a supplement to classroom presentation and discussion of the Gini Coefficient. The video links can be posted on a Learning Management System for students to watch before the appropriate class meeting. In current frameworks, the videos are paired with brief articles. One article presents background on the Gini...Download this resource to see full details. Download this resource to see full details.
Learning Goals and Assessments
Learning Goal(s):
- Content: Students will understand the logic of (and develop an appreciation of) the Gini Coefficient as a measure of inequality based on the income distribution (and the Lorenz Curve, which maps the income distribution).
- Skills: Students will cultivate their applied quantitative literacy/reasoning by addressing the Gini Coefficient as the product of a sequence of discrete steps, none of which requires more than basic mathematical understandings.
Goal Assessment(s):
- Exam question: Draw a Lorenz Curve for a society in which the poorest quintile earns five percent of the total aggregate income and the richest quintile earns half of the total aggregate income. Label both axes of the graph.
- Exam question: A) Describe conceptually how the Gini Coefficient (or Gini Index) is derived from the Lorenz Curve. B) Define the range within which the Gini Coefficient varies, and identify what each end of that range means.
When using resources from TRAILS, please include a clear and legible citation.